INTRODUCTION
Welcome to the intricate world of data analysis where every dataset tells a story, waiting to be deciphered by curious minds. As a junior data analyst, I embarked on a journey with Bellabeat, a company that stands at the intersection of health and technology, crafting devices that cater specifically to women's well-being. This case study unveils my exploration into the realm of smart device usage, uncovering patterns and behaviors that could be the key to unlocking new growth horizons for Bellabeat.
The Bellabeat Mission:
At Bellabeat, we are more than just a tech company; we are innovators, creators, and most importantly, believers in empowering women to lead healthier lives. With a suite of elegantly designed products like the Leaf Tracker and Time wellness watch, Bellabeat goes beyond mere functionality to deliver insightful health data. Our mission is to blend the artistry of our co-founder, Urška Sršen, with cutting-edge technology to inspire women globally
The Analytical Challenge:
The smart device market is brimming with potential, and to tap into this vibrant ecosystem, I was tasked with a pivotal project - to analyze smart device fitness data and draw insights that could steer Bellabeat's marketing strategy. With access to a wealth of data on daily activity, sleep patterns, and heart rate, the challenge was not just to analyze but to translate these numbers into strategic actions.
Ask
The "Ask" phase initiates the data analysis cycle by precisely defining the project scope and problem, identifying stakeholders and their expectations through SMART (Specific, Measurable, Action-oriented, Relevant, Time-bound) questions. In this foundational stage, Chief Creative Officer Urška Sršen laid out three pivotal queries to steer our analytical journey, setting a clear path for investigation.
Trends in Smart Device Usage: What story do the data points narrate about user habits and routines? Identifying these trends is the first step toward understanding the broader picture of the health tech landscape.
Application to Bellabeat Customers: How can we align what we learn from these trends with Bellabeat’s user base? The goal is to ensure that our insights resonate with our customers' needs and aspirations.
Influence on Marketing Strategy: Armed with these insights, how can we adapt and evolve our marketing strategies to stay ahead of the curve? It's about being proactive rather than reactive to consumer needs.
To answer these questions, I set out to deliver a comprehensive report encapsulating:
A clear summary of the business task at hand.
A thorough description of all the data sources utilized.
Detailed documentation of the data cleaning and manipulation stages.
A summary of the analytical findings.
Visualizations that bring data to life.
High-level content recommendations for strategic decision-making.
This blog post is not just a narrative of my case study but also a testament to the power of data in shaping business strategies. Join me as I detail each step of my journey, from the preliminary preparation of the data to the final act of drawing actionable insights. It's a tale of numbers, charts, and the relentless pursuit of knowledge in the vast expanse of data analytics.
Prepare
In the "Prepare" phase of our Bellabeat case study, we delve into the Fitbit Fitness Tracker Data, under Urška Sršen's guidance, to explore smart device usage. This dataset, publicly available through Mobius, covers thirty individuals' physical activity, heart rate, and sleep patterns. Sršen suggests supplementing this data to enrich our analysis, acknowledging its potential limitations.
Data Storage and Organization: 18 total datasets were examined. Each of them is Stored in CSV format, this data spans various aspects of user health and activity, necessitating an understanding of its structure for effective analysis.
Data Quality and Integrity:
Bias and Credibility: I critically examine the dataset for biases to ensure our findings are credible and reflective of the dataset's scope.
In this phase of my analysis, I meticulously evaluated the FitBit Fitness Tracker Data with a focus on its adherence to the ROCCC principles, ensuring a solid foundation for our insights.
Reliability: I confirmed the dataset's reliability through consistency checks and by verifying the data collection methodology. This ensures the data accurately reflects the health and activity patterns of the subjects involved.
Originality: Directly sourced from Mobius, the dataset's originality was established, providing us with a genuine snapshot of user habits and behaviours.
Comprehensiveness: Despite its detailed coverage of various health metrics, we're open to augmenting this dataset with additional sources. This approach aims to bridge any gaps and broaden the scope of our analysis.
Currency: The dataset's timeliness was assessed to ensure it captures current trends in smart device usage, an essential factor for informing Bellabeat's marketing strategies.
Cited: Given its public domain status, the data's citation was straightforward. However, we maintained rigorous documentation of our sources and analysis process for transparency and reproducibility.
Privacy and security: Confirming the dataset's public domain status, ensures our analysis respects privacy and ethical guidelines.
Challenges and Limitations
The journey through Bellabeat's data analysis was not without its challenges and limitations, which played a crucial role in shaping our approach and interpretations:
One of the primary challenges was dealing with
missing values and duplicatesin datasets like hourly_steps and weightLogInfo. We addressed this by removing rows with missing values and duplicates, ensuring the integrity of our analysis. However, this approach may have reduced the richness of our dataset, potentially impacting the depth of insights we could derive.The dataset, while comprehensive, represents a limited
sample sizeand lacks detailed demographic information. This limitation raises questions about the generalizability of our findings across Bellabeat's entire user base. Future research could benefit from a larger, more diverse dataset that includes a wider range of demographics and geographies.The datasets provided snapshots of user activity and health metrics over a limited period. While valuable for identifying short-term patterns and trends, this
temporal scopemay not fully capture long-term health behaviours and seasonal variations. Expanding the dataset to cover longer periods could yield insights into how users' engagement with Bellabeat's products evolves.
Addressing these challenges and limitations was a critical part of our analytical process, underscoring the importance of a cautious and reflective approach to data analysis. By acknowledging these constraints, we can better understand the context of our findings and guide future research directions.
Process
In the "Process" phase of our data analysis for the Bellabeat case study, I prepared the FitBit Fitness Tracker Data for detailed examination. This phase was critical in ensuring the integrity and usability of the data for generating meaningful insights.
The R script for the case study is available here
Here's a breakdown of the process:
Error Checking: My initial step involved a thorough scan for errors within the dataset. This included identifying and rectifying any discrepancies, such as outliers or inconsistencies, that could skew our analysis.
Tool Selection: For this analysis, utilized R, a powerful tool for data analysis due to its versatility in handling large datasets, and its extensive library support for data processing and visualization. R's capabilities for statistical analysis and graphical representation made it an ideal choice for uncovering patterns in the FitBit data.
Data Transformation: Transformed the data to ensure it was in a format conducive to analysis. This involved converting date and time fields to appropriate formats, normalizing data where necessary, and structuring the dataset for easy access and manipulation. For example, converting the
ActivityDateandSleepDayfields from strings to Date objects enabled time-series analyses.Data Cleaning: The cleaning process was comprehensive, addressing missing values and duplicates that could impact the quality of our insights. We employed strategies such as data imputation for handling missing values and removing duplicates to maintain the dataset's integrity. This step was crucial for ensuring the reliability of our subsequent analyses.
By adhering to these steps, we ensured that the Fitbit Fitness Tracker Data was primed for in-depth analysis, laying the groundwork for insightful discoveries that could drive Bellabeat's marketing strategies forward. This rigorous process phase underscores our commitment to data integrity and analytical accuracy.
Analysis
The choice of tools — R and ggplot2, in particular — was instrumental in managing, analyzing, and visualizing the data. R’s powerful data manipulation capabilities, combined with ggplot2’s sophisticated graphical tools, enabled us to uncover and present our findings in a clear and compelling manner.
- Data Preprocessing and Summary Statistics
1.1 Date Format Conversion
daily_activity$ActivityDate <- as.Date(daily_activity$ActivityDate, format="%m/%d/%Y")
sleepDay$SleepDay <- as.Date(sleepDay$SleepDay, format="%m/%d/%Y")
Purpose: This step is essential for preparing the datasets for time series analysis, enabling us to examine trends over time accurately.
Insight Gained: By converting date columns to the correct format, I established a baseline for temporal analysis, crucial for understanding user activity patterns and sleep cycles.
1.2 Average Daily Metrics Calculation
average_daily_activity <- daily_activity %>%
  summarise(
    Average_Steps = mean(TotalSteps, na.rm = TRUE),
    Average_Active_Minutes = mean(VeryActiveMinutes + FairlyActiveMinutes + LightlyActiveMinutes, na.rm = TRUE),
    Average_Calories_Burned = mean(Calories, na.rm = TRUE)
  )
print(average_daily_activity)
Purpose: Calculating the average daily steps, active minutes, and calories burned provides a snapshot of user engagement with their fitness devices.
Insight Gained: These averages offer a glimpse into the daily routines of the FitBit user base, highlighting general trends in physical activity and energy expenditure. It sets the stage for identifying areas where Bellabeat's products could encourage more active lifestyles.
1.3 Average Sleep Metrics Calculation
average_sleep <- sleepDay %>%
  summarise(
    Average_Sleep_Duration = mean(TotalMinutesAsleep, na.rm = TRUE) / 60,
    Average_Time_In_Bed = mean(TotalTimeInBed, na.rm = TRUE) / 60
  )
print(average_sleep)
Purpose: Understanding sleep patterns is vital for a health-focused company. By calculating the average sleep duration and time in bed, we can assess the quality of rest users are getting.
Insight Gained: This information helps us understand how well users are resting, which is crucial for overall wellness. Insights into sleep patterns can inform product features that promote better sleep hygiene among Bellabeat users.
1.4 Average Heart Rate Calculation
average_heart_rate <- heartrate_sec %>%
  summarise(
    Average_Heart_Rate = mean(Value, na.rm = TRUE)
  )
print(average_heart_rate)
Purpose: The average heart rate is a key indicator of cardiovascular health. Analyzing this metric helps us understand the fitness levels of the user base.
Insight Gained: This data can be used to tailor Bellabeat’s health and wellness advice, encouraging activities that contribute to cardiovascular health.
1.5 Average Weight and BMI Calculation
average_weight_bmi <- weightLogInfo %>%
  summarise(
    Average_Weight_Kg = mean(WeightKg, na.rm = TRUE),
    Average_BMI = mean(BMI, na.rm = TRUE)
  )
print(average_weight_bmi)
Purpose: These metrics provide insight into the general health and fitness levels of the user base, indicating areas where Bellabeat products could offer guidance or encouragement.
Insight Gained: By understanding the average weight and BMI, Bellabeat can tailor its wellness programs to help users achieve their weight management goals more effectively.
- Correlation Analysis
Purpose: The correlation analysis aims to investigate the relationship between two key health indicators: the daily total steps and calorie burn. This step is crucial for identifying patterns that can inform product development, user engagement strategies, and personalized health recommendations.
By executing the R code to calculate the Pearson correlation coefficient, we obtained a value of 0.5915681. This result indicates a moderate positive correlation between the two variables, suggesting that as the number of steps taken by an individual increases, there's a corresponding increase in the number of calories burned.
correlation <- cor(daily_activity$TotalSteps, daily_activity$Calories, use = "complete.obs")
print(correlation)
Insight:
Behavioural Insight: It confirms the intuitive understanding that physical activity, as quantified by steps taken, is an effective way to increase energy expenditure. This relationship underscores the importance of promoting active lifestyles among Bellabeat users to enhance their health and wellness.
Product Feature Development: Bellabeat can leverage this insight to develop or enhance app features that motivate users to increase their daily step count. For instance, implementing gamification elements that reward users for reaching step count milestones could be an effective strategy.
Personalized Health Recommendations: The moderate correlation provides a basis for personalized recommendations within the Bellabeat app. Users could receive customized activity goals based on their current step counts to gradually increase their calorie burn, promoting sustainable health improvements.
The correlation analysis not only validates the positive impact of increased physical activity on calorie expenditure but also provides Bellabeat with actionable insights to drive product innovation, marketing, and user engagement strategies.
Trend Analysis
Integrating Sleep and Activity Data and its subsequent analysis offer a holistic view of user behaviors, crucial for Bellabeat's mission to enhance women's health through data-driven insights. This section explores the relationship between physical activity levels and sleep quality, alongside identifying weekly trends in both activity and sleep patterns. Here's a breakdown of the insights derived and their implications:
3.0 Integrating Sleep and Activity Analysis
Objective: Combining sleep and activity data provides a comprehensive overview of user health habits. This integration allows us to explore how daily physical activities influence sleep quality and vice versa, supporting the development of well-rounded health recommendations.
codesleep_activity <- merge(sleepDay, daily_activity, by = "Id")
- We merged sleep data with daily activity data on the
IDfield, creating a unified dataset that contains information on both sleep and physical activities. This consolidated view is essential for performing cross-analysis between different health metrics.
3.1 Analyzing Sleep Quality vs. Activity Levels
Objective: To examine the correlation between physical activity levels (both very active minutes and lightly active minutes) and sleep efficiency, providing insights into how activity impacts sleep.
sleep_activity$SleepEfficiency <- sleep_activity$TotalMinutesAsleep / sleep_activity$TotalTimeInBed
activity_sleep_cor <- sleep_activity %>%
  summarise(
    Correlation_VeryActive_SleepEff = cor(VeryActiveMinutes, SleepEfficiency, use = "complete.obs"),
    Correlation_LightlyActive_SleepEff = cor(LightlyActiveMinutes, SleepEfficiency, use = "complete.obs")
  )
print(activity_sleep_cor)
- Insights: The correlation coefficients indicate a mild positive relationship between activity levels and sleep efficiency. Specifically, very active minutes show a correlation coefficient of 0.0457, and lightly active minutes have a coefficient of 0.0752. These results suggest that higher activity levels might be associated with slightly improved sleep efficiency, albeit the relationships are not strongly pronounced.
3.2 Weekly Trends in Activity and Sleep Patterns
Purpose: To identify patterns in activity levels and sleep durations across different days of the week, aiding in understanding how user behaviors vary within a week.
Weekly Activity Trends: Analysis reveals a fluctuation in average daily steps across the week, with the highest activity levels observed on Saturdays and the lowest on Sundays. This pattern underscores the variability in user activities, potentially influenced by workweek schedules and weekend leisure activities.
          library(lubridate)
          daily_activity$DayOfWeek <- wday(daily_activity$ActivityDate, label = TRUE)
          weekly_activity_trends <- daily_activity %>%
            group_by(DayOfWeek) %>%
            summarise(
              AverageSteps = mean(TotalSteps, na.rm = TRUE)
            )
          print(weekly_activity_trends)
Weekly Sleep Trends: Sleep duration trends also vary, with the longest average sleep hours occurring on Sundays and the shortest on Tuesdays. This variability might reflect a catch-up on sleep during weekends after a busy workweek.
  weekly_sleep_trends <- sleepDay %>%
    mutate(DayOfWeek = wday(SleepDay, label = TRUE)) %>%
    group_by(DayOfWeek) %>%
    summarise(
      AverageSleepHours = mean(TotalMinutesAsleep, na.rm = TRUE) / 60
    )
  print(weekly_sleep_trends)
Insight:
Product and Feature Development: Insights from integrating sleep and activity data can guide the enhancement of Bellabeat's products, emphasizing features that encourage a balance between daily physical activity and adequate rest.
Personalized Health Recommendations: Understanding the relationship between activity levels and sleep efficiency enables Bellabeat to provide personalized advice to users, promoting habits that contribute to better sleep and overall health.
User Engagement: Identifying weekly trends in activity and sleep allows Bellabeat to tailor engagement strategies, such as setting realistic weekly goals for users or encouraging activity on typically less active days.
- Visualization:
The visualization phase in data analysis is critical as it translates complex data into easily digestible visuals that can communicate key insights at a glance.

In the Daily Step Count Trend Analysis, the line graph created with ggplot2 demonstrates the fluctuation in daily step counts over time. This visualization helps in identifying patterns, such as peaks on certain days or trends over weeks, which can be correlated with user behavior or external events.
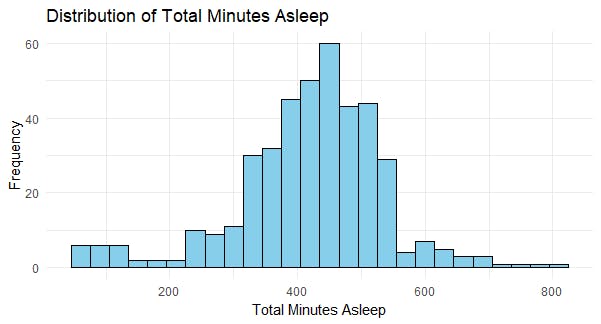
The Sleep Duration Distribution Analysis uses a histogram to show the distribution of total minutes asleep among users. This kind of plot is essential for understanding the common sleep durations and identifying outliers, which can be indicative of sleep disorders or other health-related issues.
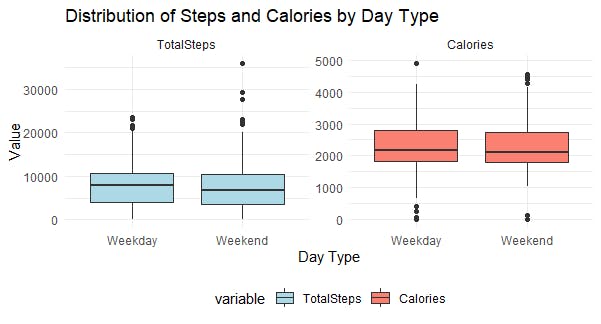
The Weekday vs. Weekend Activity and Calorie Consumption Comparison employs boxplots to compare steps and calories between weekdays and weekends. This visualization can reveal differences in activity levels and energy expenditure, suggesting potential areas for targeted health interventions or marketing strategies for Bellabeat's products.
5. Analysis and Modelling
The Analysis and Modeling phase of the Bellabeat case study presented a comprehensive approach to understanding user behavior and the impact of lifestyle choices on health metrics. Here's a detailed overview of the process and the findings:
5.1 Categorizing Activity Levels:
In this stage, users were segmented into different groups based on total step counts. This segmentation allowed for more tailored recommendations, aiming to motivate users, especially those in the lower activity brackets, to increase their physical activity. It laid the groundwork for personalized goal setting, enhancing user engagement with Bellabeat products.
5.2 Sleep Duration Variation by Activity Level:

A violin plot was utilized to examine the relationship between various activity levels and sleep duration. Interestingly, no significant differences were observed across activity levels, suggesting that factors other than daily activity might influence sleep quality. This insight hinted at opportunities for Bellabeat to develop features focused on improving sleep quality, beyond merely tracking it.
5.3 Hourly Activity Analysis:
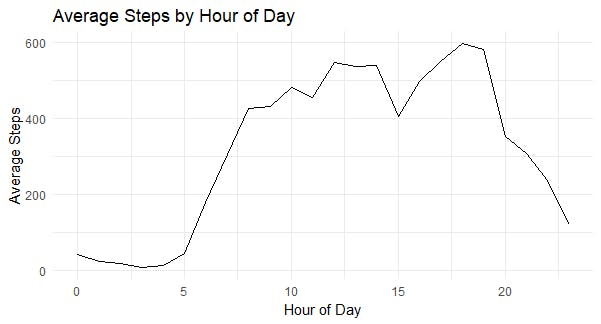
The hourly analysis of step counts uncovered distinct patterns of activity, identifying peak times when users were most active. This information is particularly useful for Bellabeat to optimize the timing of interactive prompts and reminders, aiming to boost user activity during typically inactive periods.
5.4 Visualizing Weekly Activity Patterns:
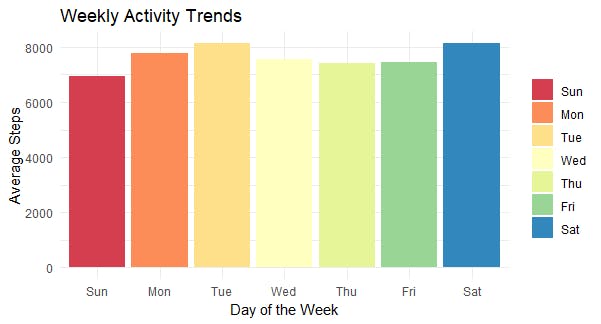
Weekly activity trends were visualized, revealing fluctuations in the number of steps taken throughout the week, with higher averages on some days compared to others. These insights are crucial for Bellabeat's strategy, enabling the company to plan weekly targets and initiatives that correspond with users' active and rest days
5.5 Analyzing Weekly Sleep Duration Trends:
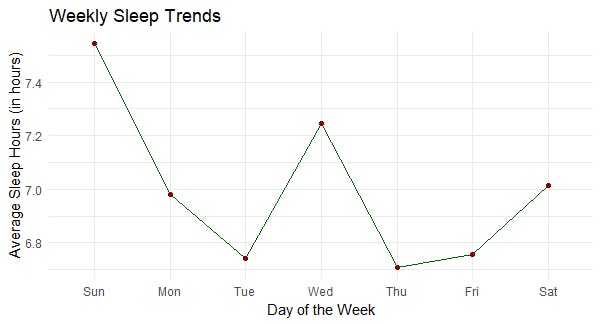
Sleep trends depicted a pattern where users seemed to catch up on sleep over the weekends. This valuable information could steer Bellabeat's content strategy, influencing the advice provided for weekend activities and suggesting ways to improve sleep during the workweek.
5.6 Trend Analysis Over Time:
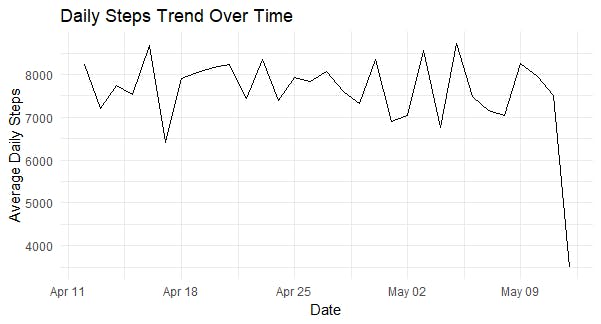
A trend line for daily steps was plotted to identify behavior changes over time. This long-term view revealed seasonal trends and behavioral shifts, informing Bellabeat's marketing strategies and product updates to align with these patterns.
5.7 Predictive Modeling:
A regression model was developed to predict daily step counts based on users' activity and sleep data. With an R-squared value of 0.6568, the model demonstrated a strong ability to forecast step counts, offering a substantial advantage for setting personalized and attainable daily goals within the Bellabeat ecosystem.
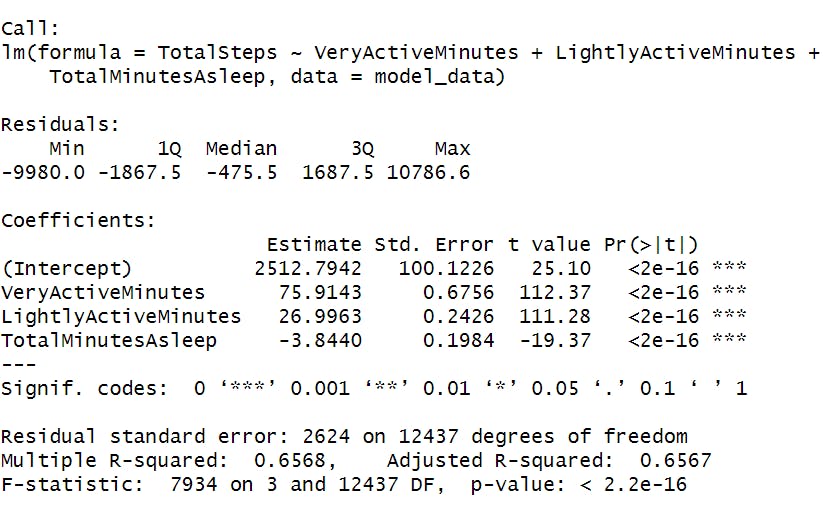
Reflecting on the process, the Analysis and Modeling phase underscored the value of data-driven insights in shaping product development and user engagement. The findings from this phase promise to help Bellabeat in crafting experiences that not only engage but also foster healthier lifestyles among its user base. The phase culminated in actionable outcomes that are expected to propel Bellabeat's mission of empowering women through informed health decisions.
SUMMARY
At Bellabeat, a journey into the data of smart device usage unveiled a tapestry of user behaviors, each thread revealing a pattern, a habit, or a health insight. This exploration, driven by the analytical prowess and dedication to Bellabeat's mission, has shed light on the daily rhythms of activity and rest, the silent beats of a heart, and the very essence of well-being as captured by our users' smart devices.
Key Findings of the Analysis and Modeling Phase:
Segmentation and Personalization: The analysis successfully categorized users into distinct activity levels, setting the stage for Bellabeat to deliver personalized experiences. By understanding where each user stands on the activity spectrum, Bellabeat can now craft motivational strategies that resonate on an individual level, nudging every user towards a healthier lifestyle.
Sleep Insights: The data revealed a nuanced picture of sleep across activity levels. Contrary to expectations, more active users did not necessarily experience longer or better-quality sleep. This finding suggests that Bellabeat could explore innovative features that support sleep quality beyond activity tracking, potentially offering a holistic approach to rest and recovery.
Activity Rhythms: Hourly step counts painted a clear picture of daily life's ebb and flow. The Bellabeat team now holds valuable insights into the times when users are most and least active, providing a golden opportunity to encourage movement during quieter hours with timely notifications and challenges.
Weekly Trends: Visualizations brought to light the weekly cadence of users' lives. With higher activity levels on weekends and varied sleep patterns, Bellabeat can align its interaction points and recommendations with the natural rhythm of its users' weeks, ensuring relevance and effectiveness.
Seasonal and Long-term Trends: Trend analysis over time uncovered the larger currents shaping users' activity habits. These insights are instrumental for Bellabeat's marketing and product development teams, allowing for strategies that anticipate and adapt to the shifting needs and behaviors throughout the year.
Predictive Strength: The development of a regression model to predict daily steps stands as a testament to the predictive power of data. With an R-squared value that inspires confidence, Bellabeat can look forward to setting achievable, customized goals for users, fostering engagement and progression toward better health.
Real-world Applications of Insights
After uncovering significant insights from the data analysis, Bellabeat has numerous opportunities to enhance its product offerings and marketing strategies. Here are a few scenarios that showcase how Bellabeat could leverage these insights:
Wellness Challenges: Utilizing the correlation between activity levels and sleep quality, Bellabeat could introduce a "Holistic Wellness Challenge" within their app. This challenge could encourage users to achieve a balanced routine of physical activity and restful sleep by setting daily goals that adjust based on their progress. Rewards could include virtual badges or discounts on subscription services.
Feature Development: The discovery of peak activity hours and variability in activity across the week presents an opportunity for Bellabeat to develop personalized activity reminders. For example, a "Smart Nudge" feature could send users prompts to move during their least active hours or motivate them with suggested activities that align with their current activity level.
Community Engagement: Insights into the weekly trends in physical activity and sleep could be used to foster community engagement. Bellabeat could organize weekly group challenges or forums where users share tips on maintaining an active lifestyle and improving sleep habits, building a support network within the app.
The journey through the data has not just been about numbers and patterns; it's been about connecting with the very pulse of Bellabeat's users. The insights gleaned promise to fuel a new wave of features, campaigns, and interactions that speak directly to the hearts of our users. As Bellabeat continues to sculpt the landscape of women's health technology, the data analysis case study stands as a beacon of our commitment to data-driven decision-making and our relentless pursuit of empowering women to lead their healthiest lives.
Share&Act
The concluding stages of the data analytics process are centred around interpreting the results from your analysis and effectively communicating these findings to stakeholders. This crucial step aids in guiding informed decision-making and prompts the initiation of strategic actions based on the insights provided. In the development of the analytical dashboard, special consideration was given to ensure accessibility for stakeholders with colour vision deficiencies. This approach guarantees that the visualizations are clear and distinguishable, thus enhancing comprehension and ensuring an inclusive analytical review environment. The dashboard can be found here.